Description
Visualization is a co-listed 4th year undergraduate and graduate course that focuses on graphical techniques
for data visualization that assist in the extraction of
meaning from datasets. This involves the design and development of efficient tools for the exploration of large and often complex information domains.
Applications of visualization are broad, including computer science, geography, the social sciences, mathematics, science and medicine, as well as
architecture and design. The course will cover all aspects of visualization including fundamental concepts and the
role of human perception.
Course Schedule
- Instructor: Dr. Stephen Brooks
- Class Location: MCCAIN ARTS and SS 2162
- Class Time: 2:35pm - 3:55pm
- Office Hours: Mona Campbell 4206, Fridays 10-11am
Books on Learning d3 (none are required!)
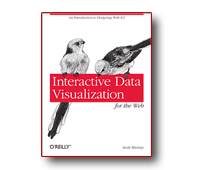
- Interactive Data Visualization for the Web: An Introduction to Designing With D3, Scott Murray.

- Learn D3.js: Create interactive data-driven visualizations for the web with the D3.js library, Helder da Rocha.

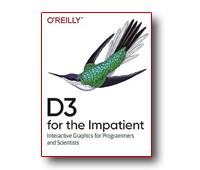
- D3 for the Impatient: Interactive Graphics for Programmers and Scientists, Philipp Janert.

General Books on Visualization (none are required!)
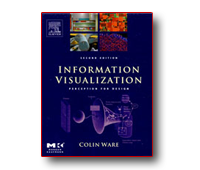
- Information Visualization: Perception for Design by Colin Ware, Morgan Kaufmann.

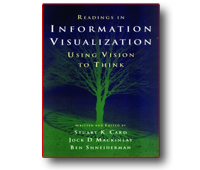
- Readings In Information Visualization: Using Vision to Think by Stuart K. Card, Jock D. Mackinlay & Ben Shneiderman, Morgan Kaufmann.

4166 Prerequisites
- either CSCI 3161.03 - Computer Animation
- or CSCI 3160.03 - Designing User Interfaces
- or CSCI 3172.03 - Web-Centric Computing
|
6406 Prerequisites
|
Learning Outcomes
- Explain the key concepts of information visualization and applications
- Discuss models of visualization and knowledge representations.
- Apply theories of visual perception of presentation, texture and color.
- Understand the role of:
- Dimensionality (2D, 3D, volumetric, high dimensionality)
- Navigation, scale and zooming
- Efficiency, constraints, occlusion, focus plus context, level of detail
- Realism vs. Non-photorealism
- Compare competing interactive approaches for:
- Graph structures, trees and networks
- Data queries, data editing and customization of visual data
- Evaluate and critique an existing visualization system.
- Discuss the applications of visualization.
- Design and develop an interactive visualization system.
4166 Grading
- Attendance (5%)
- Assignment (20%)
- In Class Test (25%)
- Final Project (50%)
|
6406 Grading
- Participation (10%)
- Assignment (10%)
- Presentations with reports and reviews (30%)
- Final Project (50%)
|
Academic Honesty
All work you submit must be your own. It is fine to discuss problems, but when it comes time to submit solutions,
the materials you hand in must be done individually, by yourself. Any materials referenced must be attributed.
All suspected instances of academic dishonesty must be reported to the Senate Discipline Committee.
In particular, you should never show another student code that you have written for an assignment in this course,
nor should you write code for another student to use in his/her assignment. Note that this specifically prohibits
working with other students when writing the code for your assignments. As I said above, it is fine to discuss problems,
but the code you submit must be your own, written by you alone.
For further information regarding academic honesty at Dalhousie, please see the University plagiarism website.
Also note that all assignments and projects will be checked for plagiarism using automated software.
Late Submission Policy
Late work will be penalized 5% per day (or part thereof). You will not receive credit for work that is more than 3 days late.
Return to main page.


