
|
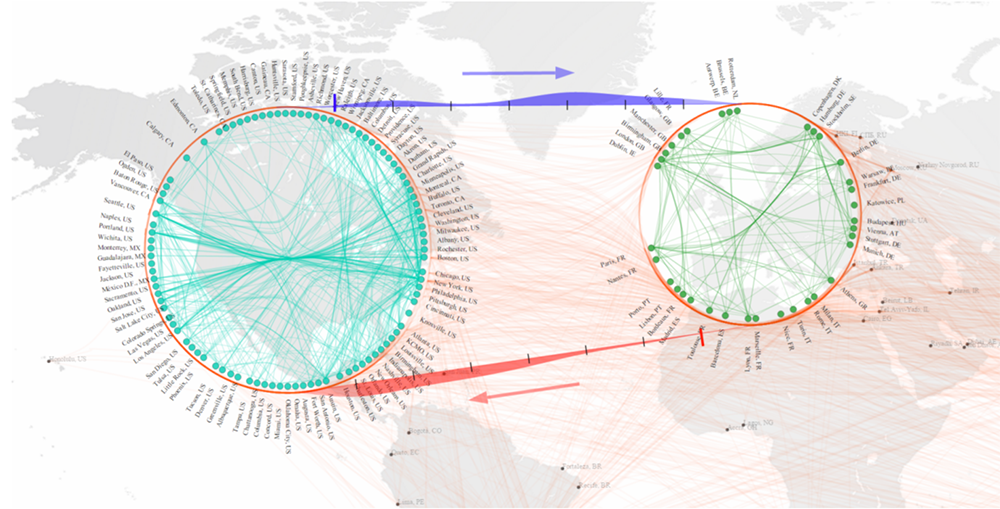
A dynamic approach for revealing the underlying information in locally cluttered areas within a geo-spatial connected graph while maintaining global edge trends. Two time series data-flow visualization approaches at both local and global scales are proposed respectively: a stream model focuses on data flows within the local area while a hub model addresses the relations between groups of nodes across the graph. The computational complexity and quantitative performance analysis on three different datasets were conducted to examine the scalability of the visualization model. The simulation results show that the central algorithms in our approach are able to achieve acceptable performance in real world test cases. Figures Publications
|
