User Interface
We used three interfaces within a web browser in our tests:
- one interface had no special features (and is not shown here);
- one interface presented a glossary containing pre-defined terms (shown in Figure 4-T-1); and
- finally an interface much like the previous one but that allows users to update the glossary (shown in Figure 4-T-2 with numbers labeling parts of the interface).
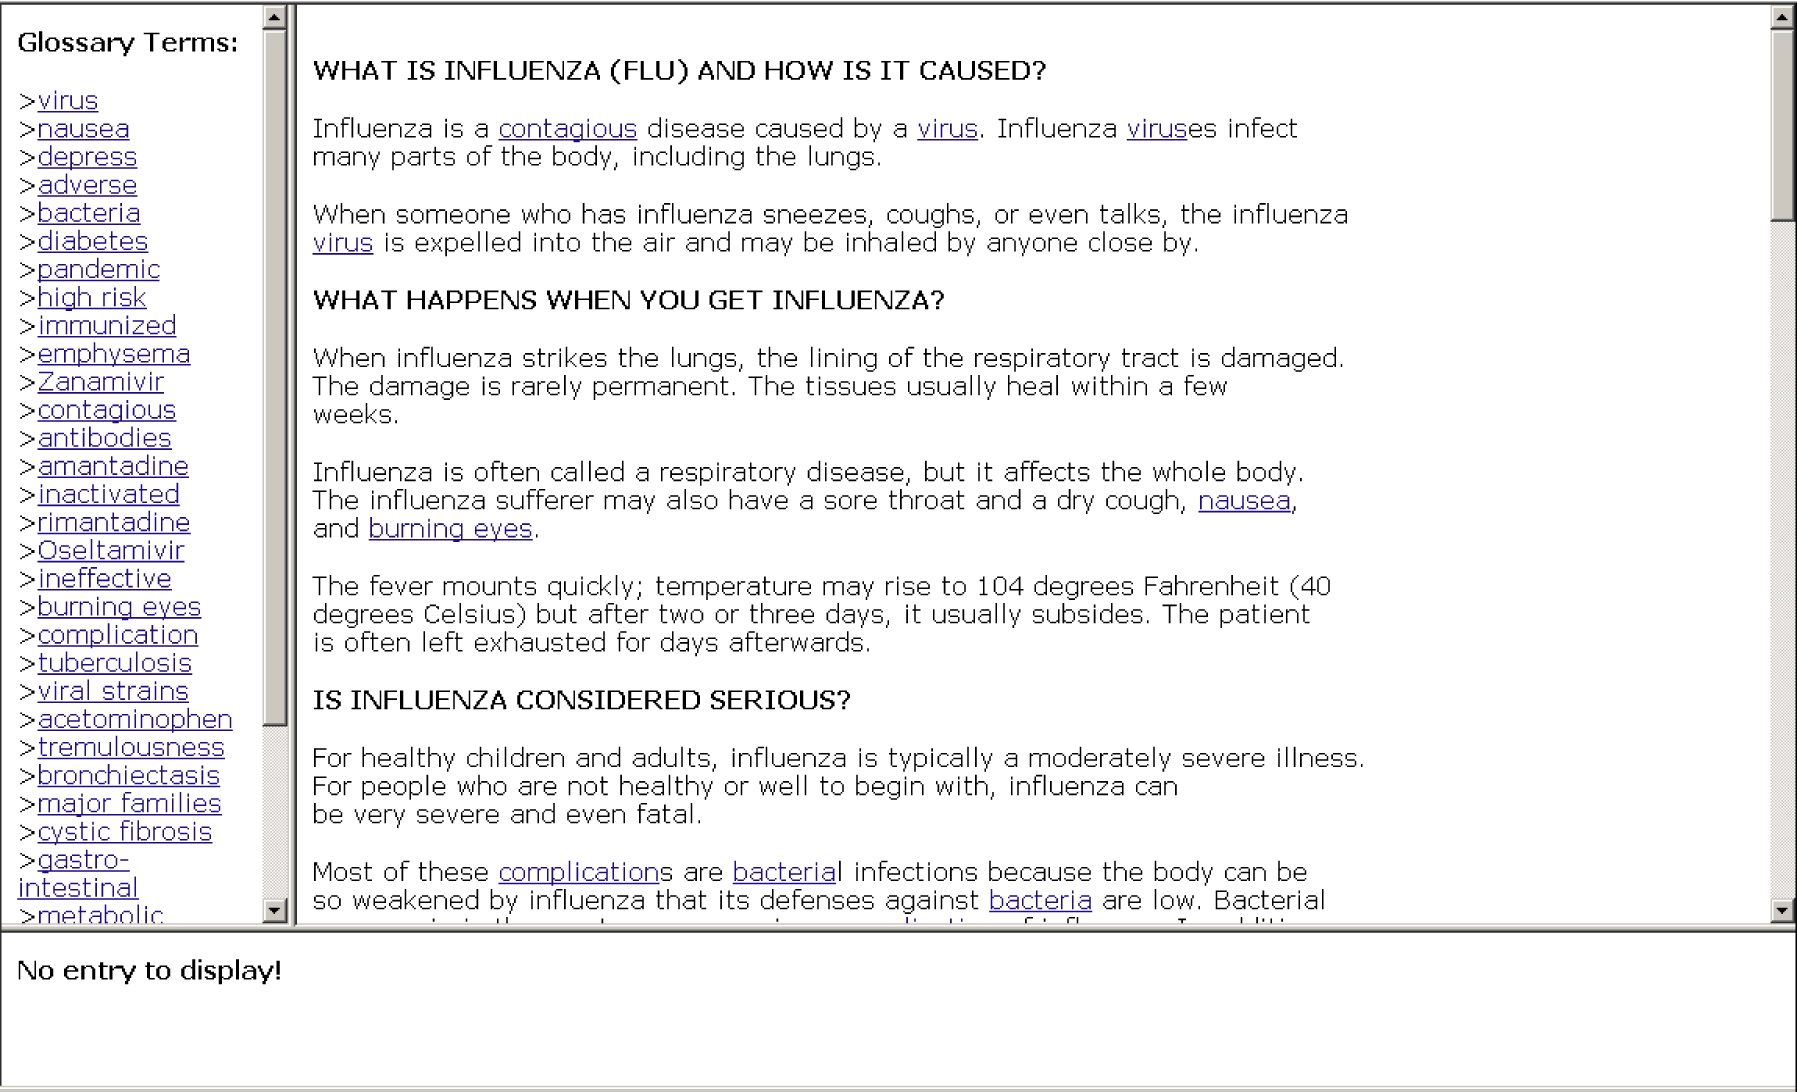
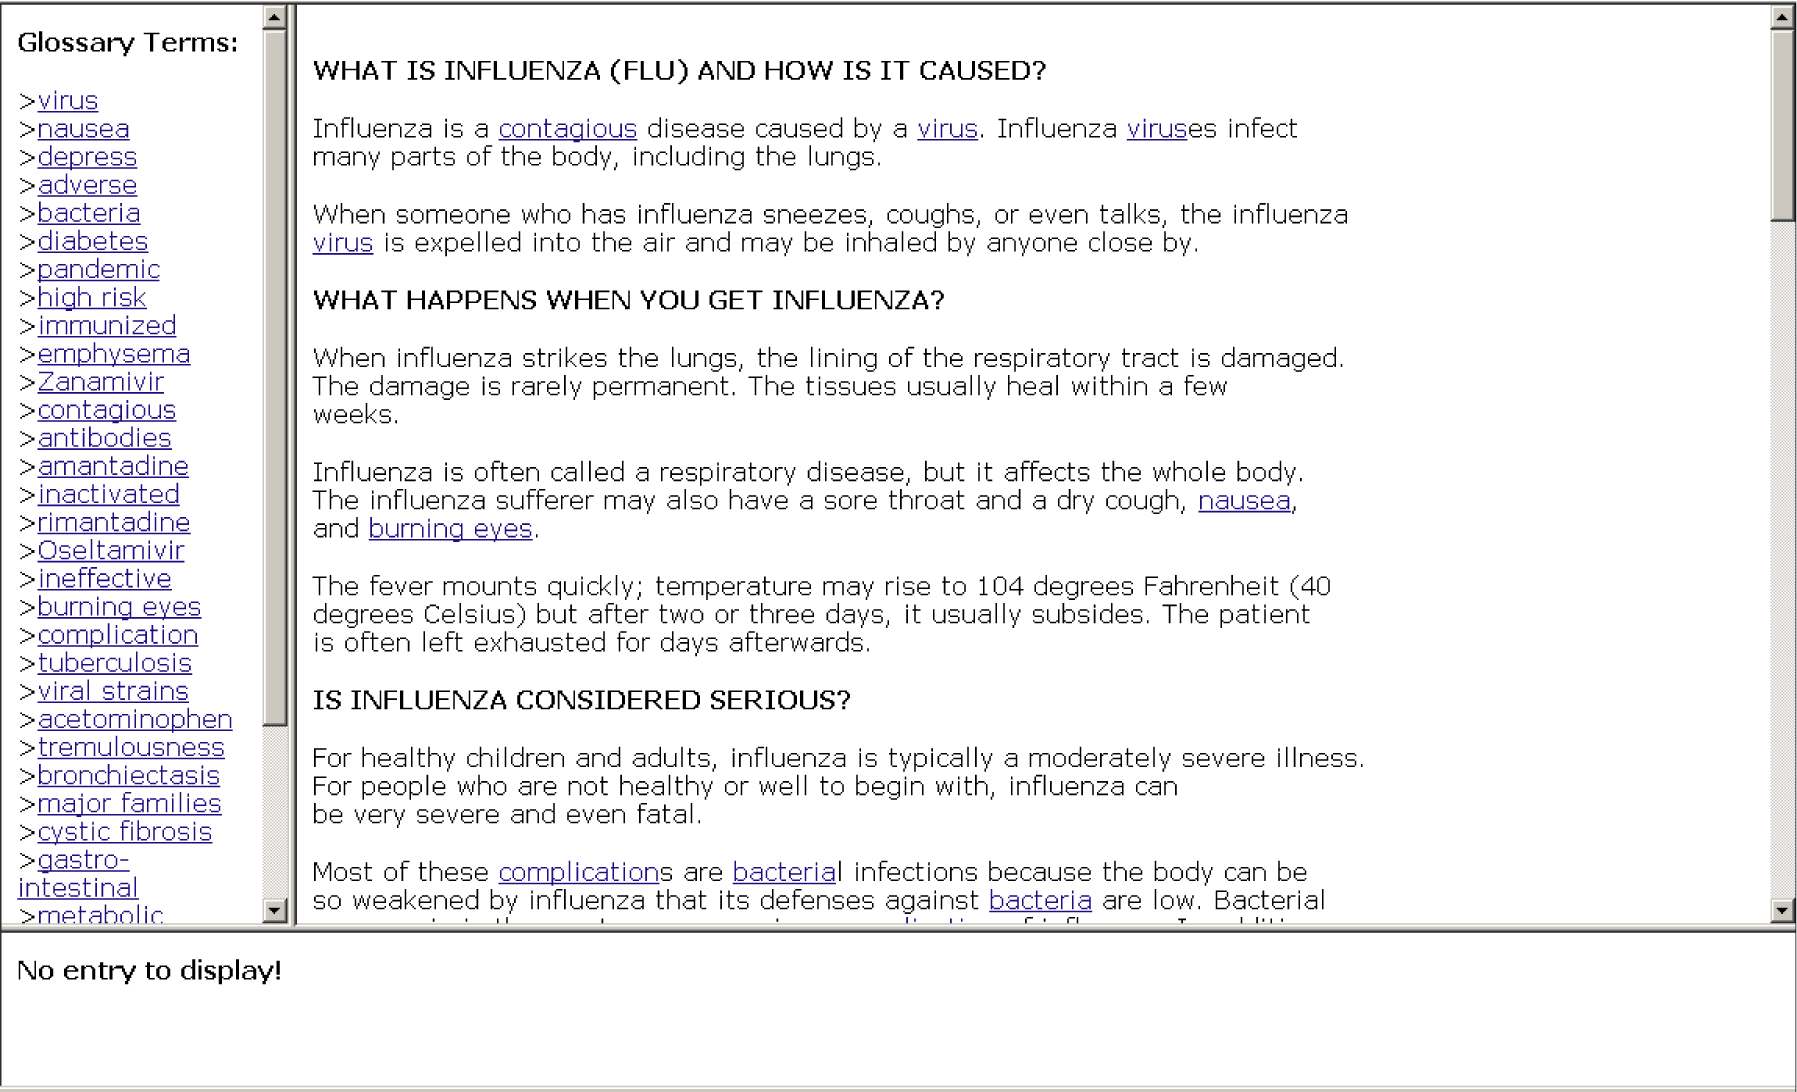
Figure 4-T-1: Automatic glossary tool interface
[select this link to view image without surrounding text]
The more complex interface is shown in Figure 2.
This second interface is for the user-updateable glossary tool.
It is identical to the basic interface (shown in Figure 1)
except that it includes a toolbar at the bottom of the window
(labeled  in Figure 2) which allows its users
to modify, delete, and add new entries to the glossary.
in Figure 2) which allows its users
to modify, delete, and add new entries to the glossary.
(Note that the labels ( … ) are not part of the
interface but are used only for the description below.)
… ) are not part of the
interface but are used only for the description below.)
The interface for the user-updateable glossary tool (shown in Figure 2) is divided into four sections:
-
The main text is displayed in the largest division, which is
located in the upper right.
 A list of glossary terms is provided in the left-hand division,
while glossary entries are displayed in the bottom division.
A list of glossary terms is provided in the left-hand division,
while glossary entries are displayed in the bottom division.
 Glossary terms in the main text are underlined and clicking on
these underlined terms displays the corresponding glossary entries
in the first of the bottom divisions (the lower division will be
discussed shortly).
Glossary entries can also be accessed by clicking on the terms
listed in the left-hand division.
Glossary terms in the main text are underlined and clicking on
these underlined terms displays the corresponding glossary entries
in the first of the bottom divisions (the lower division will be
discussed shortly).
Glossary entries can also be accessed by clicking on the terms
listed in the left-hand division.
-
A toolbar below the at the bottom of the window is
available only in the user-updateable interface.
This toolbar allows users to modify or delete exiting entries
and to add new entries to the glossary.
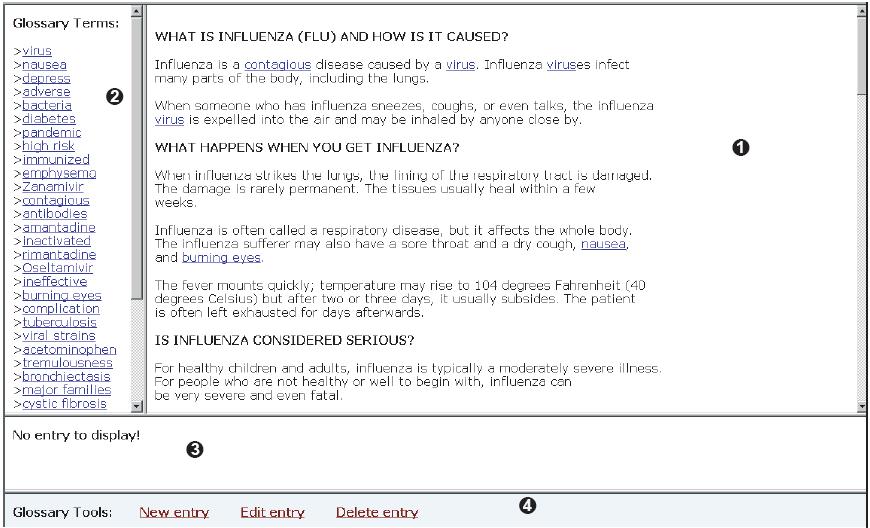
Figure 4-T-2: User-updateable glossary
tool interface (with parts labeled)
[select this link to view image without surrounding text]
Our design deals with matters arising from previous research . In particular:
- terms are underlined in the main window
- definitions appear where they do not occlude the text
- all of the definitions are available for reading at any time
- the articles were initially formatted to have line lengths between seven and ten inches when displayed on screen at standard font sizes. However the participants were allowed to change font and window sizes.
We used a mixed design. The comparison of the glossary tool and no glossary tool conditions were within subjects (in which every participant was their own control) but the comparison of tools themselves was between subjects (in which participants were pooled into groups which were then compared).
Evaluation Experiment
Following Blustein
[2000] we evaluated our prototype for speed (efficiency),
accuracy (effectiveness), and satisfaction (an affective measure) in
a realistic context.
A naturalistic experiment involving human beings is extremely
complex and could not be performed without some artificial
constraints.
We sought to capture some aspects of the real-world
tasks people perform with documents.
However, to be valid, the experiment could not be completely free
form.
[Blustein,
2000, p. 204]
The experiment was a mixed design: the comparison between the glossary and non-glossary treatment was within-subjects, but the comparison between the two glossary tools was between-subjects. A total of forty participants completed the study. Every participant undertook two sessions, each with a different glossary type and document. All treatments (choice of health conditions, which of their two sessions involved exposure to a glossary, and which type of glossary the participant was exposed to) were randomly assigned.
-
This is a detailed summary of the method used. For complete details see the earlier technical report [Noor, 2003].
Type of Task
We tried to simulate a real-world condition in which people would want to understand a text with unfamiliar terms. We asked experimental participants to read online articles about diseases with the goal of understanding their severity and treatment options. Participants were told to imagine that they, or a child in their care, had recently been diagnosed with the condition as motivation to understand the text.
The choice of health conditions, and whether participants began with a glossary or not (and which glossary they used) was randomly assigned. Articles were adapted from the WebMD [2002] website. Glossary terms were chosen manually and definitions extracted algorithmically [Kaindl et al., 1999] and sometimes manually.
When the participants had completed reading the articles and answering the questions about them, they were asked to complete a questionnaire measuring their subjective appreciation of the glossary tool they were given to use. A debriefing session followed where participants were asked to express any comments about their performance during the study. The debriefing allowed participants to openly express their views on the software and describe what areas they felt required improvement. It also proved useful in the collection of subjective data from the participants.
-
Hypotheses
The purpose of the experiment using the two glossary tools was to determine if the presence of a glossary tool:
- improved readers' comprehension of technical texts online,
- decreased the time needed to read the text online.
We were also interested in differences between the two tools. Specifically we tried to determine whether or not users of one tool were (a) faster or (b) demonstrated better comprehension than the other.
We operationalized comprehension by using a questionnaire about the specific health conditions (asthma, bronchitis or influenza). Participants answered the questions before and after reading the texts. We measured how much users' scores improved after reading the text under various treatments (without a glossary, or with one of the two glossary options).
-
Dependent Variables
In order to have the data to test the hypotheses above, the following evaluation measures were collected and calculated:
- The average time taken to read each article.
- The average increase or decrease in scores from the preliminary questionnaires to the post-test questionnaires.
- The average time taken to complete the post-test questionnaires.
- The average number of glossary terms accessed for viewing when a glossary tool was provided with the article.
- The average number of glossary terms that were edited or deleted when the user-updateable glossary tool was provided.
- The average number of new glossary entries that were created when the user-updateable glossary tool was provided.
Experimental Participants
Forty participants from various backgrounds took part in the study. All participants were familiar with the use of computers and as such, represented the target audience for the glossary tool. Self-selection bias was not expected. Therefore, the presence of any skewing due to selection bias is not expected in the results.
The participants were informed that they were taking part in a user study that was attempting to determine the usability of glossary tools for technical reading as well as their usefulness for such a purpose. The participants were also told that a summary of the results of the study was likely to be published.
Materials
The articles used for the study discussed asthma, bronchitis and influenza. These are health conditions that affect a considerable part of the general population. A large number of individuals may therefore be interested in reading about these conditions. It is likely, however, that these individuals are not familiar with the specific details presented in the articles chosen. This would give the participants incentive to read the articles with greater attention to detail.
Experimental Protocol
The usability test involved participants reading technical articles concerning selected health conditions. Users' understanding of these articles was measured through the use of questionnaires with related questions. Users' subjective appreciation of the glossary tools was also measured with another questionnaire designed for this purpose. In addition, the users were given the opportunity to leave general comments about the system.
Each participant was greeted by the researcher. At that point, the participants were asked to read and sign consent forms describing the study and their willingness to take part in it. The participants received scripted introductions and orientation concerning the study. The function of this was to explain the purpose of the study as well as to provide the participants with additional information regarding what was required of them as part of the study. The participants were then made aware that they would be observed and that their actions with regards to the glossary tools would be logged by the software. After the participants had taken part in the orientation, had asked any questions they wished answered and were satisfied with the information they received, they were asked to proceed with the study.
The study started with participants answering questions about a health condition. This condition was randomly chosen from asthma, bronchitis or influenza. After they had answered the questions, participants were presented with an article about the same health condition. The article may have been presented without a glossary tool, with an automatic glossary or with a user updateable glossary. This was also random. Once the participants were comfortable with the material in the article, they were asked to fill out another set of questions about this same health condition. This process was repeated with a different, randomly chosen, health condition. Every participant was presented with an article without a glossary tool and another article with either an automatic glossary or a user updateable glossary. The type of glossary tool they received was random.
The time taken for each participant to complete reading each of the articles was recorded. Notes were also made about relevant participant behaviour, any comments the participant may have had or any unusual incidences that occurred. The glossary tool software also logged the number of glossary terms accessed for viewing, editing and deletion. The numbers of glossary entries created by users of the user-updateable glossary were also recorded.
The questions chosen for each article were intended to measure general knowledge of the condition discussed in the article. The answers to these questions could be obtained from the articles themselves. The questions were formulated so that answers to them could clearly be classified as either correct or incorrect without any ambiguity. The answers were marked as either right or wrong and a questionnaire score was calculated as the number of correctly answered questions divided by the total number of questions. The score assigned to each article was calculated as the questionnaire score for the questionnaire after reading the article minus the questionnaire score for the questionnaire before reading the article.
When the participants had completed reading the articles and answering the questionnaires about them, they were asked to complete a questionnaire measuring their subjective appreciation of the glossary tool they were given to use. A debriefing session followed where participants were asked to express any comments about their performance during the study.

